Structured Data For Semantic Web Analytics
Learn what is Web Semantic Analytics and how to extract structured data from web pages and blend it, in Google Data Studio, with traffic from Google Analytics.

Introduction
Adding structured data to your website means enriching your data with information that makes your content easier for Google and search engines to understand. This way, your website and the search engines can talk to each other, allowing you to have a richer representation of your content in Google’s SERPs and increase organic traffic. You’ll then get more clicks and growth for your business.
With structured data in modern SEO, you can create an impact, and this impact is measurable whether you have a large or small business.
Focus on the importance of structured data beyond numbers (clicks, impressions, etc) and the advantage that you can gain in modern SEO.

Much of the adoption we see of modern standards like schema.org (particularly via json-ld) appears to be motivated by organizations and individuals who wish to take advantage of search engines’ support (and rewards) for providing data about their pages and content but outside of this, there’s a rich landscape of people who use structured data to enrich their pages for other reasons. Web Almanac
So structured data is not just the data we prepare for Google; it’s data that helps you understand the meaning of web pages.
If you want to learn how to get semantic analytics with WordLift, read our article.
What Is Structured Data For Semantic Analytics?
The Semantic Web has changed the way we approach web content. As Tim Berners Lee himself says, the world is not made of words but is made of something more powerful: data. This means that to improve search engines’ understanding of web content, it is necessary to have a high-quality dataset enriched with information in structured data.
Structured data allows Google and search engines to understand what you’re talking about on your website and rank better by returning users with enriched results in SERPs. In this way, users can find relevant information that better meets their search intent.
We talk about entities and no longer about keywords. They represent “concepts” and allow machines (Google and search engines, voice assistants, etc.) to interpret what we know about a person, organization, place, or anything described in a document.
In this scenario, Semantic Web Analytics is the use of named entities and linked vocabularies such as schema.org to analyze the traffic of a website.
With this type of analysis, you’ll start from your website’s structured data, and you’ll be able to cross-reference it with the data from Google Analytics, Google Search Console or your CRM. In this way, you’ll be able to learn more about your users/customers and their behaviors, gaining a strategic advantage over impression and traffic data alone. As we’ll see below, with just a few clicks, you can extract structured data from web pages and blend it, in Google Data Studio, with traffic from Google Analytics.

How To Use Structured Data For Semantic Analytics
It’s clear that structuring information goes beyond search engine support and can also provide value in web metrics analysis.
At this point, we show you how you can extract structured data from web pages and blend it with Google Analytics traffic in Google Data Studio. You’ll also see how this will allow you to gain insights into web analytics.
We start from a demo website that we built for demonstration purposes. If you have a small business, with a small number of products, you can crawl your content by using a Streamlit application. Otherwise, if you are at a more advanced level and you have a large number of products, you can use Colab, working with the SEO crawler of Advertools, the free library created by Elias Dabbas, available here. With this system, you can crawl hundreds of thousands of URLs. But it has a pitfall: it is not able to detect structured data that has been injected with javascript.
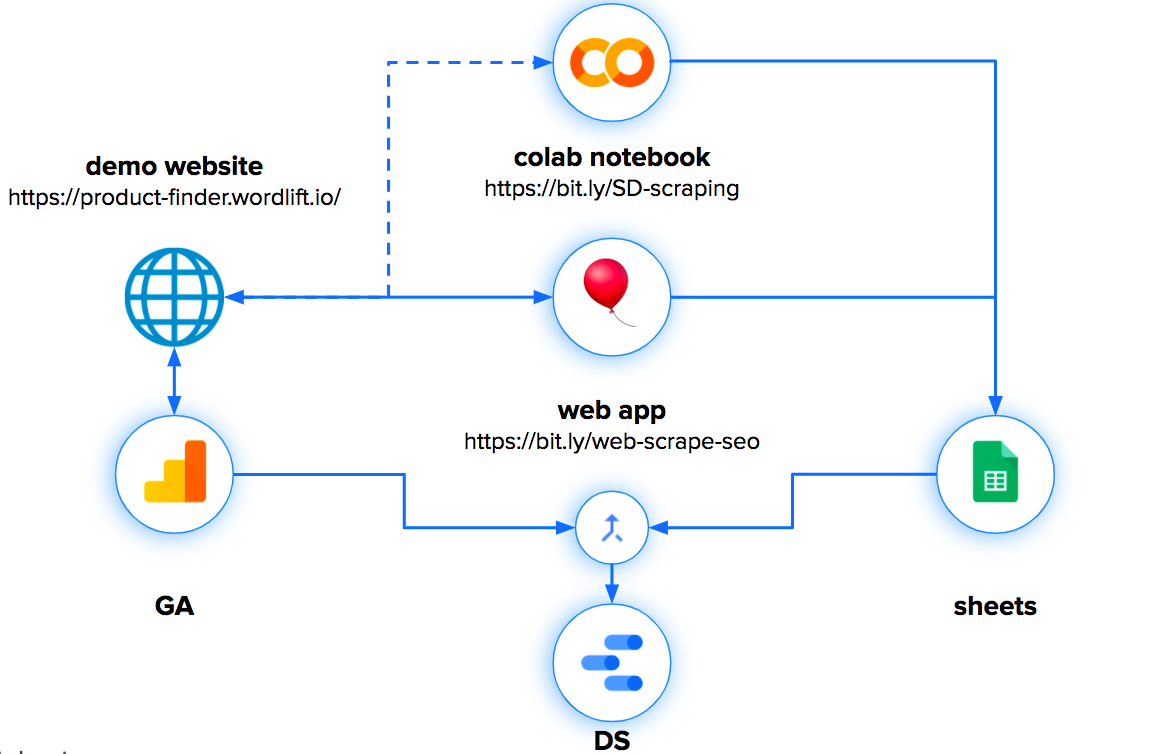


Then the data will be brought by the crawler in Google Sheets and blended in Google Data Studio in order to have one single view.
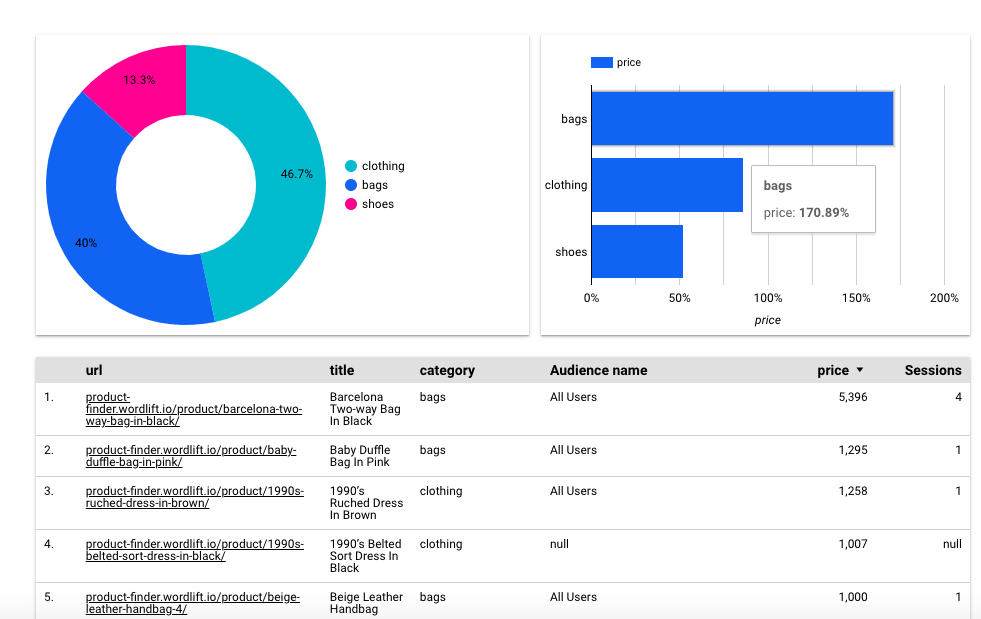
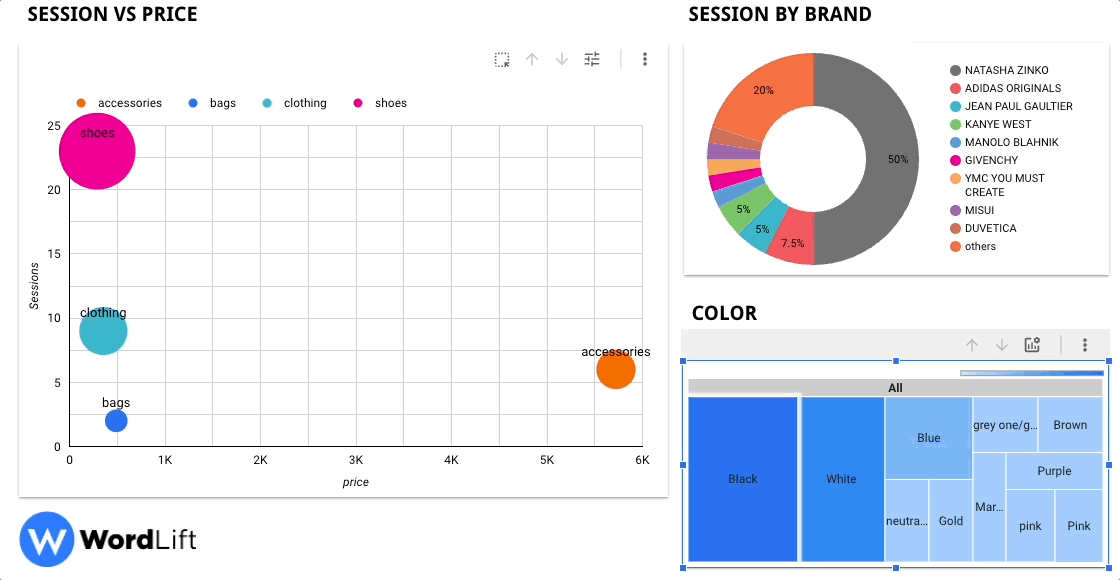
You can create a Data Studio Dashboard where you can select and see some specific insights. Here, for example, you can see the breakdown of the session in Google Analytics with the category. So we can see that clothing is accounting for 50% for the session.
How Do Blended Sources In Google Data Studio Work? Blending Data Is Simple.
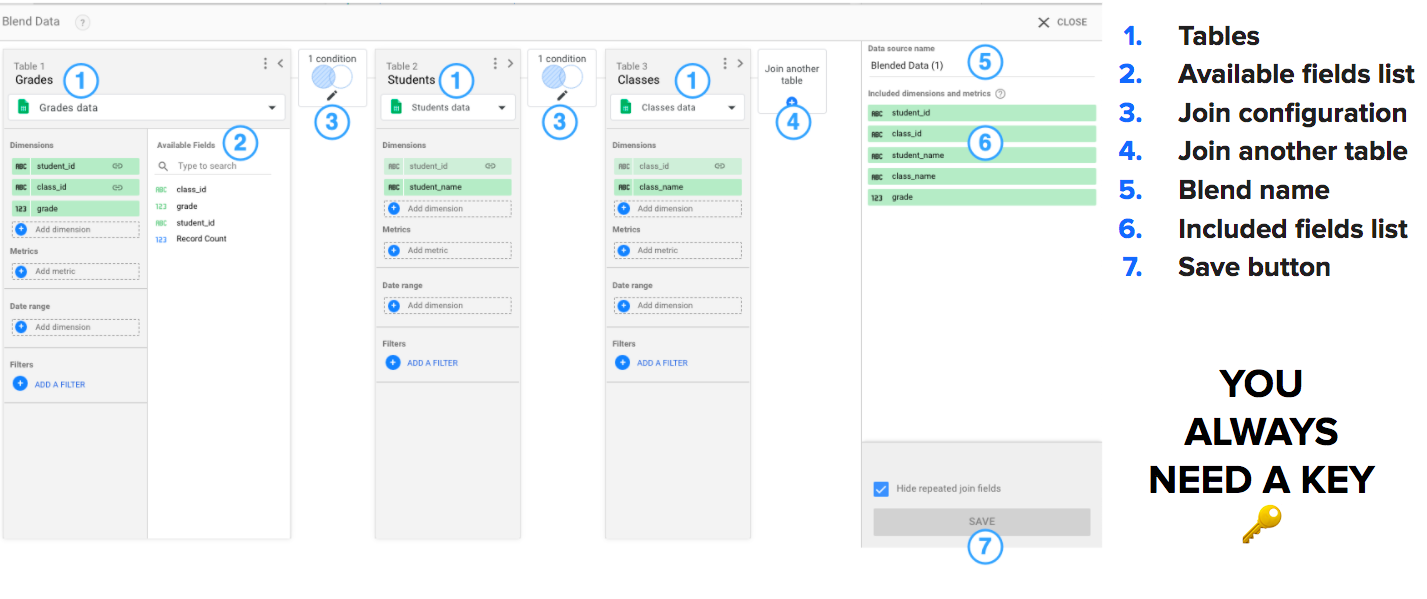
As you can see in the image, you have tables (in our case, Google Sheets and Google Analytics) and a list of available fields that you can use from this table within the join to create a view of combined fields.
Then you have the join configuration; that is how you want to blend this data. You can decide to take everything from the left table that overlaps with the right table, or you want to look at the strict overlap of the inner.
Then you have the name of the blended source that you will create and the fields that you will represent inside this blended source which is a view on one, two or more tables combined by a unique key. In this example, the unique key is the URL.
You are using the URL on both sides to combine them and these allow you to look at the analytic, for instance the session, by looking at the category.
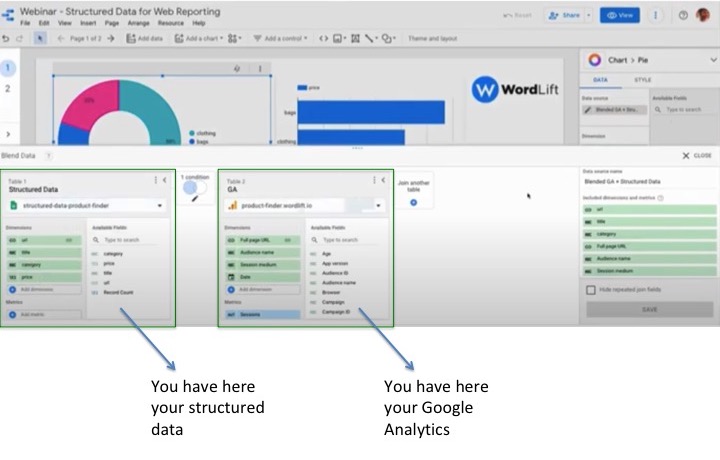
If you want to see something more advanced, you can blend the second Spreadsheet with Google Analytics. In this case, you have more data, such as the color and the brand name, and you can create a chart using the product category, the session, and the price. This way, you can see traffic for each product category and the price. You can also see the breakdown of the colors and the brands.
You can play with different combinations in order to have the right data. Extracting structured data from your web pages and blending it with Google Analytics data gives you a more precise and more accurate picture of your users’ behavior with just a few clicks. This is particularly useful to improve your marketing strategy and grow your business in a data-driven way.
Keep In Mind: Structured Data Has Its Pitfalls.
- Structured data, when injected using Javascript, cannot be easily crawled;
- Data is messy and/or inconsistent;
- Multiple syntaxes appear on the same page;
- Multiple tools can add contradicting statements;
- Competitors have better data.
We discussed this topic in the webinar Google Data Studio Structuring SEO Data Tips&Tricks, hosted with Windsor.AI – Watch the video.
If you want to know how to create a Web Analytics Dashboard using Google Data Studio, traffic data from Google Analytics, and WordLift, read this article.
Frequently Asked Questions
What is Semantic Web Analysis?
Semantic Web Analytics is the analysis of a website’s traffic done using named entities and related vocabularies such as schema.org.
With this analysis, you can start from the website’s structured data and cross-reference it with data from Google Analytics, Google Search Console, or other CRM. In this way, you can learn more about user and customer behavior and gain a competitive advantage beyond just analyzing impressions and traffic.