
What is the technical definition of knowledge graph?
A knowledge graph organizes information so that both people and machines can understand the data and how its pieces are connected.
Although the concept has been studied for decades, the term gained widespread recognition in 2012, when Google introduced its Knowledge Graph to enhance search results by focusing on topics rather than individual strings of text.
Today, Google’s Knowledge Graph contains over 1600 billion facts on nearly 55 billion entities. This scale shows how central knowledge graphs have become for connecting information on the web and powering modern search.
What is the Technical Definition of Knowledge Graph?
A knowledge graph acquires and integrates information into an ontology and applies a reasoner to derive new knowledge. (Lisa Ehrlinger and Wolfram Wöß – University of Linz in Austria)
Structured Representation
A knowledge graph is a structured representation of real-world entities and their relationships, visualized as a network of nodes (entities) connected by edges (relationships). This framework acts as a database, enabling complex queries by understanding the context and connections between various pieces of information. Knowledge graphs enhance AI applications by improving information retrieval and reasoning capabilities across multiple data sources.
Entities and Relationships
Useful concepts, places, people, organizations, etc. are organized into entities that can be brought up to display important information about the entity from a wide database. These entities connect through each other through various relationships.
Modern knowledge graphs often integrate entities across domains. For example, this might include linking a product to its manufacturer, reviews, and supply chain. This creates a richer web of context.
Implementation in Practice
It utilizes machine learning technology to develop applications to collect and display custom search engine results programmatically. Some knowledge graphs utilize special programming such as Google, which uses JSON API and schema.org markup to create schematic data that enables website content to be embedded in the SERP.
JSON-LD has become the most widely adopted format for implementing schema.org. It’s supported by Google, Microsoft Bing, Yahoo, and Yandex as the standard for structured data on the web.
Academic Research and Context
The term knowledge graph has been frequently used in research and business, in close association with Semantic Web technologies, linked data, web-scale data analytics, and cloud computing. At SEMANTiCS, a few years ago, a research paper titled “Towards a Definition of Knowledge Graphs” by the Institute for Application Oriented Knowledge Processing of the University of Linz was presented to propose a definition of the knowledge graph that focuses on data modelling and reasoning.

A 2020 study has also explored the combination of symbolic reasoning from knowledge graphs with statistical machine learning. The aim is to make AI systems both more explainable and more accurate.
The Rise of Knowledge Graphs
Over the last decade, knowledge graphs have moved from research labs and niche applications to mainstream use. Their ability to connect information in context has made them essential for search engines, digital platforms, and enterprises that want to unify data across many sources.
Industry Adoption
The popularity of the term is strictly connected with the launch of the Google Knowledge Graph in 2012 and by the introduction of other large databases by major tech companies, such as Yahoo, Microsoft, AirBnB and Facebook, that have created their own “knowledge graphs” to power semantic searches and enable smarter processing of data.
In recent years, Microsoft has expanded its knowledge graph beyond Bing to power LinkedIn’s professional graph and its AI assistants. Amazon relies on product graphs to structure its marketplace, which connects hundreds of millions of items with reviews, sellers, and customer behavior.
Meta has also shifted its social graph into the backbone of recommendation systems across Facebook and Instagram.
Semantic Web and Triples
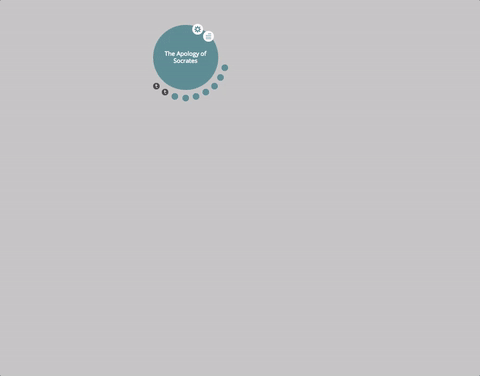
In the context of the Semantic Web, a knowledge graph is a way of representing knowledge. In short, you start from a few triples and those triples are put in a relationship to build a graph. For instance, let’s have a closer look – using Semantic Web technologies – at the Apology of Socrates entity on this blog:
Source: LodLive
As you can see we have a set of triples that tell us a story: The Apology of Socrates, also known as Apology of Socrates is about Socrates, has been written by Plato and mentions the concepts of Daemon and Socratic Dialogue.
Language of Machines
A knowledge graph doesn’t speak any particular language. Language is human; a knowledge graph gets expressed in open linked data, which is the language of machines.
This machine-readable layer is what enables different systems and platforms to share and reuse structured knowledge consistently.
Part of the Larger Web
Imagine your entire website built upon a large knowledge graph made of all the metadata that describes the thing that you write about. That knowledge graph becomes part of a larger graph that comprises the new web. That is the power of the Semantic Web.
Today, this connected layer of structured data powers search engines. It also enables voice assistants, recommendation engines, and AI applications that depend on reliable context.
Is A Knowledge Graph A Graph?
Knowledge Graphs are a way to store both information and its meaning. Imagine an Excel table, but with every line written according to a specific shared convention. More than this: imagine each line of this Excel table to be connected with many other lines.
For now, I’ve asked you to imagine it as a table (an Excel table). Still, a good way of visualizing the relationships between information inside a knowledge graph is by laying out the information in a graph.
What kind of graph? Imagine a family ancestry tree or even an organizational structure where each department head is linked to the CEO. These are simple graph representations that you can also use to display information in a knowledge graph.
Today, most large-scale knowledge graphs are managed using graph databases such as Neo4j, Amazon Neptune, and Microsoft Azure Cosmos DB. These tools enable the efficient storage and querying of billions of nodes and edges, far exceeding the capabilities of a simple table.
Visualization platforms now let users explore these graphs interactively, which makes it easier to trace connections across huge datasets.
How Does A Knowledge Graph Work?
A knowledge graph works by showing the relationships between each statement in it. We call the statements (or the lines in the Excel table) “entities.” And that’s where a knowledge graph reveals its smarts. Once I put entities in a relationship with one another, I can feed this information to all sorts of machines that will instantly make meaning.
If I write that Andrea is the CEO of WordLift, all of you human readers (and a part of the computers) will understand this statement. But suppose I use the “Organization” schema to store the same information in a knowledge graph. In that case, I will be 100% sure that all machines will comprehend this.

In recent years, these principles have extended beyond web markup. Knowledge graphs are used in AI systems to provide structured context for large language models, a technique known as retrieval-augmented generation (RAG). By linking entities and relationships, knowledge graphs help ground model outputs in reliable facts, thereby reducing the risk of inaccurate or “hallucinated” responses.
How Do You Draw A Knowledge Graph?
Computers are great at drawing knowledge graphs. They can trace the relationships between each entity as lines and each entity in the graph as a node. See the example below.
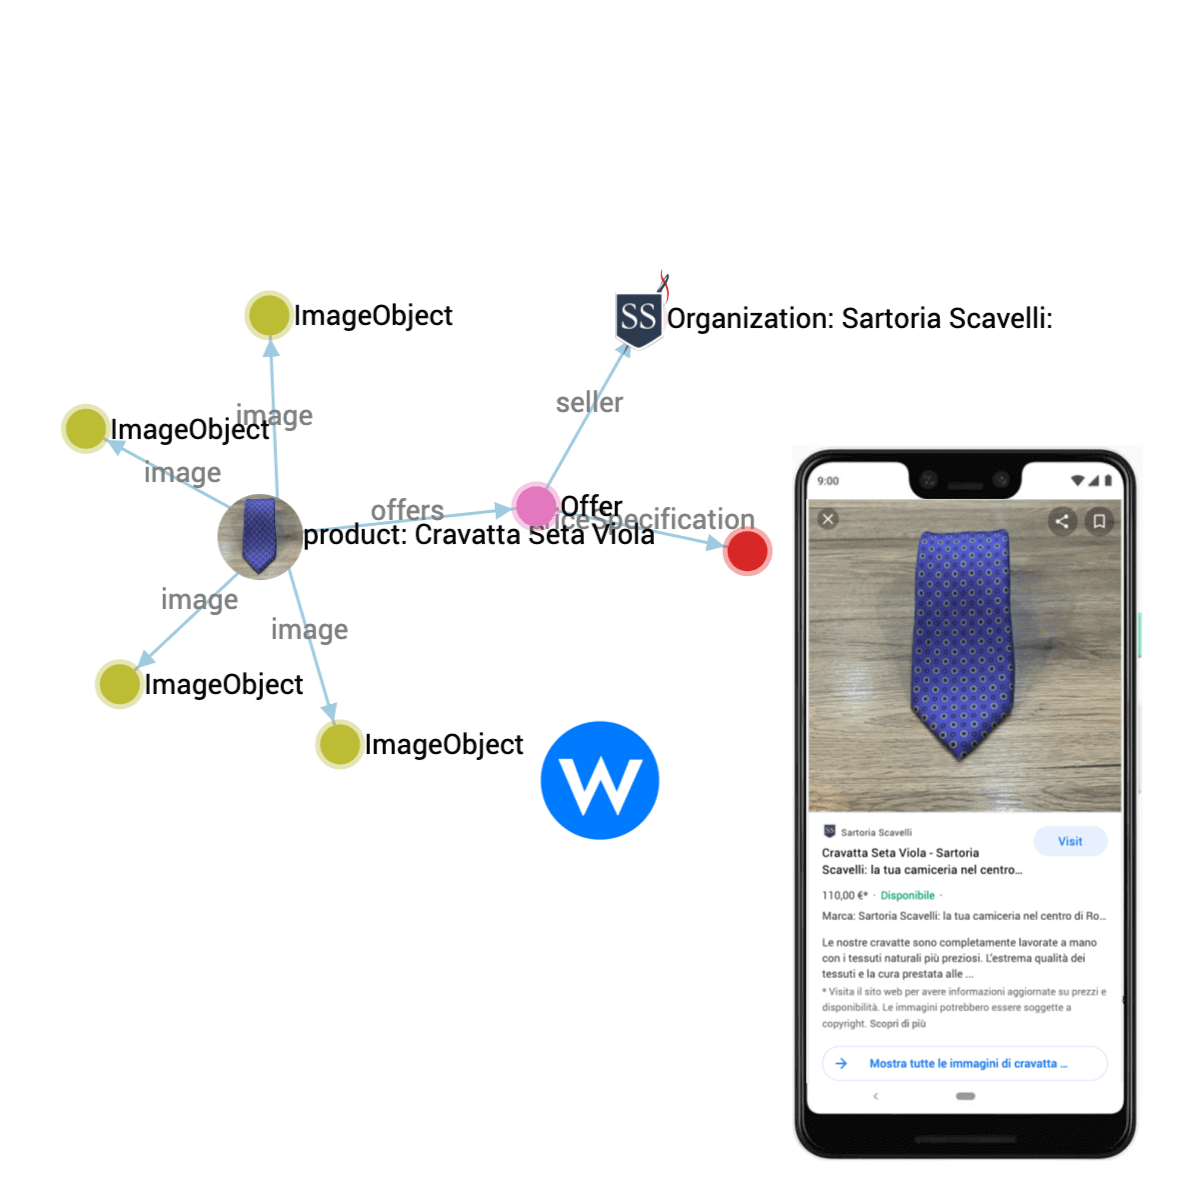
It shows a product graph, where a tie (“Cravatta Seta Viola”) is linked to its images, an offer, the seller (Sartoria Scavelli), and specifications. Each of these elements is a node, and the connections between them (e.g., “seller”, “offers,” “image”). Together, they form a map of knowledge that search engines can read to generate rich product cards in the SERP.
Thanks to interactive visualization tools like Neo4j Bloom and Graphistry, it’s now possible to explore graphs with billions of relationships. In e-commerce and publishing, for example, help product teams and content strategies see how their data is connected and spot missing links.
Here are some tips for drawing knowledge graphs:
- Start with entities you already describe: Products, authors, categories, or locations
- Add images and attributes: Just like the tie graph links to ImageObjects and specifications, enriching nodes improves visibility.
- Define relationships clearly: For example, a product offers a specification or an organization sells a product. These relationships drive what search engines display.
- Use standard vocabularies: schema.org and JSON-LD make your graph interoperable and machine-readable.
- Visualize to check coverage: Tools like Neo4j Bloom, Graphistry, or even lightweight web visualizers let you see gaps or redundant links at a glance.
When you apply these steps consistently, you can turn raw product data into structured knowledge—the same principle behind how the example appears as a rich result in Google Search.
How Are Knowledge Graphs Used In Machine Learning?
Knowledge Graphs are some of the best training data you can feed to machine learning algorithms. The strong ties between entities help computers extract the meaning behind the data. Knowledge Graphs are a great way to train a model because of their semantic nature.
Today, Knowledge Graphs are also used to supply structured context to ML models. Let’s look at some examples. As I mentioned above, retrieval-augmented generation (RAG) combines Knowledge Graphs with LLMs to ground answers in factual information.
Graph neural networks (GNNs) further extend this by utilizing the graph structure directly in training. This is particularly useful in fraud detection, drug discovery, and recommendation engines.
Knowledge graphs are often applied in security contexts too, helping map complex relationships across users, data, and cloud workloads. Tools like a CNAPP (Cloud-Native Application Protection Platform) rely on connected data to give you a complete picture of risks and dependencies across environments, which is essentially a knowledge graph in action.
What Is The Difference Between An Ontology And A Knowledge Graph?
A knowledge graph is data organized following ontologies. The most widespread ontology is schema.org, adapted most importantly by Google for their Google Knowledge Graph.
The difference between the two is that ontology provides the rules and vocabulary. It’s the abstract model of how entities and relationships should be described. A knowledge graph, on the other hand, is the actual data structured according to that model. Think of the ontology as the blueprint and the knowledge graph as the built structure populated with real-world information.
Schema.org remains the backbone of structured data on the web; however, new domain-specific ontologies are gaining traction in areas such as healthcare (SNOMED CT, HL7 FHIR) and finance (FIBO).
What Is Not A Knowledge Graph?
Not every dataset is a Knowledge Graph. To be qualified as a knowledge graph, information needs to be both organized and connected. A knowledge graph’s goal is always to make sense and meaning of its data and not just represent information.
So, you likely now have a good idea of what a knowledge graph is. But what isn’t a knowledge graph?
A static spreadsheet of products or a list of customer names is not a knowledge graph. Without meaningful relationships (e.g., “purchased by,” “manufactured by,” “linked to”), the data remains flat. What makes a dataset a knowledge graph is the explicit linking of entities to create context.
What Is The Google Knowledge Graph?
In 2012 Google revolutionized its search engine by launching its knowledge graph. Their focus started a change from search terms to topics (or entities). We devote a whole article to describing Google’s Knowledge Graph and its far-reaching consequences.
However, at its core, the Google Knowledge Graph is a vast database that underpins search features such as knowledge panels, featured snippets, entity-based results, and Google’s AI-powered Search Generative Experience (SGE). It shifted the foundation of search from strings of keywords to a structured understanding of people, places, and things.
Why Should I Pay Attention To Knowledge Graphs?
The main reason all businesses should pay close attention to knowledge graphs is their role in SEO. Adding structured data to your web pages is a sure way of increasing your rankings and getting more organic traffic. E-commerce websites can especially benefit from Product Knowledge Graphs.
That said, the advantages of a knowledge graph are far more significant: more and more companies are building their business around more innovative data stores. A knowledge graph allows them to find more customers and serve them better. Some companies even move their whole company database to the graph, making connections and meaning throughout their business.
For companies like Abacus Life, which offers services like insurance brokers, a knowledge graph can help organize and connect information across clients, policies, and services. By mapping relationships between data points such as client profiles, coverage options, and claims history, Abacus Life can gain deeper insights, streamline decision-making, and deliver more personalized service. This approach turns complex data into actionable knowledge, enhancing both efficiency and the customer experience.
What Are Some Popular Knowledge Graphs
There are many different types of knowledge graphs developed by different companies that are used for different purposes. While many companies use an internal or smaller knowledge graph for online functions, some of the biggest ones are being used by many people all over the world. Below lists a selection of some of the largest knowledge graphs to date from Microsoft, Google, Facebook, IBM and eBay.
| Developer | Purpose & Function |
| Microsoft | Uses knowledge graph for the Bing search, LinkedIn‘s professional graph, and AI assistants (Copilot). |
| Knowledge graph is embedded in Google Search and devices, powering knowledge panels, featured snippets, and the SGE. Also integrates with Google’s Gemini AI models. | |
| Meta | Social graph connects people, content, and events, and now underpins recommendation systems across Facebook, Instagram, and Threads. |
| IBM | Provides enterprise frameworks (e.g., Watson Knowledge Catalog) that help companies build and govern internal knowledge graphs, often for compliance and data integration. |
| eBay | Operates a product knowledge graph that connects users, products, reviews, and transactions, powering eBay’s search, personalization, and recommendation engines. |
| Amazon | Runs one of the world’s largest product knowledge graphs, connecting hundreds of millions of items, sellers, and reviews. It also supports Alexa and AWS services |
| Apple | Maintains a growing knowledge graph to power Siri, Apple Search, and its app ecosystem. |
| OpenAI | Uses knowledge graphs in retrieval-augmented generation pipelines to support LLMs with structured knowledge. |
Most people conducting SEO will tend to focus on the Google Knowledge Graph as it’s the most frequently used and relevant knowledge graph for SEO.
Google is the most popular search engine and the driver behind much search engine innovation. Therefore, it’s important to focus on developing entities and embedding them into the knowledge graph.
Microsoft’s knowledge graph is still worth paying close attention to. While fewer people use Bing, plenty do use Microsoft’s services, including LinkedIn.
So while Google may be the primary focus of SEO and entity development, it’s essential not to forget about Microsoft. Thankfully, they both use schema markup, so developing entries for both of them shouldn’t be too difficult.
Other knowledge graphs may be helpful in SEO in certain circumstances. For example, Meta’s knowledge graph might be useful for branding, local businesses, and people hosting events for embedding in their social network. IBM’s knowledge graph might be helpful in working within the internal knowledge graphs of other companies, but may still hold value for SEO.
The same goes for eBay’s knowledge graph, though it is more uncertain, as their knowledge graph is still in the early stages of implementation and development.
Furthermore, Amazon’s product graph drives e-commerce visibility, Apple’s graph powers Siri and Apple Search, and OpenAI uses graphs in RAG to improve AI answers.
There are also many more knowledge graphs not listed above that are used by many publishers and developers across many different platforms.
Knowledge Graphs aren’t just limited to search engines or AI applications—they’re increasingly valuable in industries that require precise and timely information management. For instance, medical courier services rely on accurate tracking, complex routing, and real-time updates to deliver critical samples, medications, and medical equipment.
By leveraging Knowledge Graphs, these services can map out intricate networks of hospitals, laboratories, and delivery points, optimize routes, and ensure that time-sensitive items reach their destinations efficiently. This not only improves operational efficiency but also reduces the risk of errors, helping save both time and lives.
What Is The History of Knowledge Graphs?
Believe it or not, but the history of knowledge graphs and their use predates both search engines and the internet as a whole. Many of you may remember the graphs used in Geometry, Algebra and Calculus classes in high school or college. Knowledge graphs function in a similar manner, only instead of lines and shapes being used to connect points on a graph, entities are connected to other entities through lines of structured data and schema markup.
In 1735, famous mathematician Leonhard Euler was presented with a problem in the city of Königsberg, Prussia in what is now Kaliningrad in modern-day Russia. There were 7 bridges in the city that connect through a central island and run across the Pregel River, and the challenge was whether or not it was possible to form a straight path where every bridge is crossed only once. Rather than making every possible walk throughout the city to figure this out, he chose to create the first chart and plot out the city and the endpoints of every bridge. While his ultimate conclusion was that this was not possible, he ended up inventing graph theory in the process.

While Graph theory continued to develop throughout the centuries, the first major breakthrough in developing the basis of knowledge graphs came in 1966 with Joseph Weizenbaum’s development of the ELIZA computer program. The program would use a system of code known as DOCTOR to conduct machine learning in a manner that would allow the program to communicate with humans as though it were an empathetic therapist. This enabled the software to conduct a primitive version of queries and delivering results. Although Weizenbaum began to question the nature of his program and the role of artificial intelligence, ELIZA laid the important foundations of knowledge graphs to come.
Taking both graph theory and machine learning technology provided by ELIZA, the development of the enterprise graph was the next major step in the development of knowledge graphs. Enterprise graphs were developed to organize and identify all available information on a specific topic, field, person, product, etc. within an organization. Think of it as an internal knowledge graph or database utilized within a specific company, organization or industry. It’s not known when exactly the first enterprise graph was developed, though the development of knowledge graphs by Google and Facebook in organizing their content and entities. While it took a while before knowledge graphs could properly get off the ground, they’re certainly starting to shine today.
So, the concept of representing relationships as a graph predates both the internet and modern computing. Here’s a brief timeline:
- 1735: Leonhard Euler developed graph theory while studying the problem of the bridges of Königsberg.
- 1966: Joseph Weizenbaum’s ELIZA program demonstrated how structured patterns could support machine interaction.
- 2000s: Semantic Web technologies emphasized linked open data and ontologies.
- 2012: Google launched the Knowledge Graph.
- 2020s: Knowledge graphs became common in search engines, enterprise data systems, and machine learning applications.
What Is The Future of Knowledge Graphs?
The first knowledge graph was launched by Google on May 12th, 2012 as a means of enhancing the value of the knowledge provided by the search engine. By using structured data through schema markup, a user could provide information in HTML code that could then be picked up and used in knowledge cards and the newly developing featured snippets. What this meant is that websites could gain traction by providing answers to queries directly on the SERP.
Other search engines and companies began to also develop knowledge graphs. Some, like Microsoft, developed them for a similar purpose to Google; while others, like Facebook, have been developing them for different reasons, namely people and events as opposed to general knowledge about the world. When it comes to SEO, schema markup has expanded to be compatible with Yahoo and Microsoft Bing in addition to Google, making it easy to provide markup for the top search engines.
Today, knowledge graphs are being utilized in many companies and provide a knowledge network for a variety of different functions. As knowledge graph technology continues to develop and evolve, it faces many new challenges. Issues like changing knowledge, potential consequences of machine learning, managing identities, as well as concerns regarding security and privacy are all ongoing issues facing many knowledge graph developers. These issues will continue to be a challenge for some time to come and perhaps more so in the future.
Looking ahead, knowledge graphs will expand in several ways. First, they’re becoming increasingly multimodal, linking not just text but also images, audio, and video.
Second, they’re tightly integrated with AI systems, grounding outputs with structured facts. Third, more enterprises are adopting domain-specific knowledge graphs to ensure compliance, improve decision-making, and power recommendation engines.
Finally, governance and interoperability are becoming priorities. Standards, such as the Resource Description Framework (RDF), the Web Ontology Language (OWL), and schema.org, are evolving to support cross-platform graph exchange.
Putting It All Together
Knowledge graphs have come a long way from academic experiments in the Semantic Web to powering the backbone of modern search, e-commerce, and enterprise data systems. They organize information so that both humans and machines can understand not only individual facts but also how these facts connect.
Whether to improve how products appear in search results, connect patient data in healthcare, or organize supply chains, the underlying principle is the same: connect the data, and the meaning comes to life.
As a business owner, building and maintaining a knowledge graph is a way to future-proof content, make information discoverable, and create a foundation for smarter decision-making. The more consistently data is connected and enriched, the more value it generates.