
![]()
If you are an SEO, you constantly struggle to measure your strategy’s impact in the most precise and irrefutable way; Causal Impact, a methodology originally introduced by Google, helps you exactly with this. In this blog post, I will share a Colab notebook that will help you, starting from data coming from the Google Search Console (GSC), to run a Causal Impact Analysis.
I present you in the code two options:
- download data from GSC and upload it on Google Sheets
- get data directly from GSC using the APIs and a great library by Josh Carty 🙏. When following this option, we will also be able to provide a list of URLs for which we want to run the analysis
The data on Google Sheet linked in Colab is related to a LocalBusiness markup optimization task.
What is Causal Impact Analysis?
It’s a statistical analysis that builds a Bayesian structural time series model that helps you isolate the impact of a single change being made on a digital platform.
Let’s say you have decided to improve the structured data markup of a local business and you want to know how this particular change has actually made impacts on traffic that we see coming from Google.
This sounds simple because you could just compare the measures before adding the new markup and after the change. But, it’s actually hard to measure in the real world because there are so many attributes that could influence the end results (e.g. clicks from Google). The so called “noise” makes it hard to say – yes, this actually has created a positive impact.
Google had the same problem and Kay Brodersen and the team at Google built this algorithm called Causal Impact to address this very challenge and open-sourced it as an R package. In the code I provide you here I am using a library called pycausalimpact developed by William Fuks 🙌
Let’s look at the code
1. Install libraries
2. Download data from Google Search Console and publish it using Google Sheets
3. Download data using GSC API
Remember that this is an alternative step to the previous one but it has the advantage that will allow you to selectively choose the URLs that you wish to analyze. In order to get access to the data in GSC we will need to go through the authentication process.
Getting access to GSC API
To access the Google Search Console API, you’ll need to create the Google Developer Console credentials. As it’s quite a detailed process, I suggest you follow the awesome SEO, Jean-Christophe-Chouinard. Jean has detailed the instructions and you can follow his guide.
Reminder #1: the user interface in Developer Console changes with time so that navigation elements might change; however, you must follow the steps described in the link above.
Reminder #2: Please note that you should be logged into the Google Developer Console with the same Google Account you’ll want to access Google Search Console.
When done, download and save a JSON copy of your “client secrets” file from the Google Developers Console, it’s also a good idea to keep a copy of this file somewhere for safekeeping on your hard drive as you can reuse it for all your work with GSC API in the future.

Add the domain name as you see it in the list of connected domains in the form, also. Add the number of days for which you will need to extract the data. For example, to get the data from the last 60 days, we will write -60.

In the step below we can paste the list of URLs that we want to analyze. Just remember this will be a comma separated list of urls.

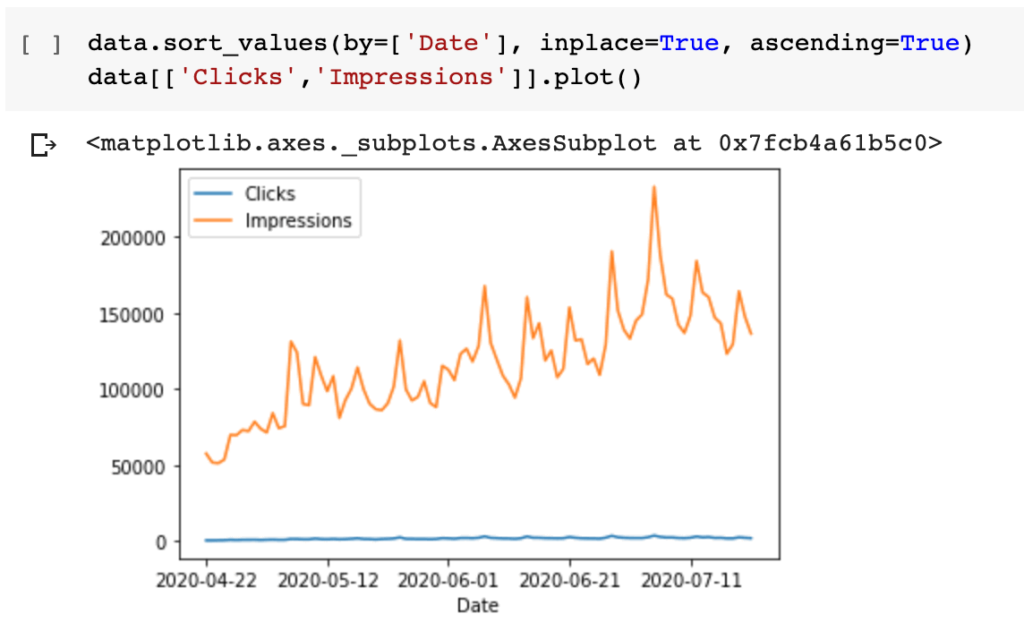
3. Plot data
Here we only want to make sure we’re getting the right data into the analysis.
4. Configure pre and post periods
Here you will need to be careful and configure the dates before (pre_period) and after (post_period) the change.
Keep in mind that CI will create a prediction by analyzing the data in the pre_period and it will subtract the prediction from the post_period to see the actual impact.
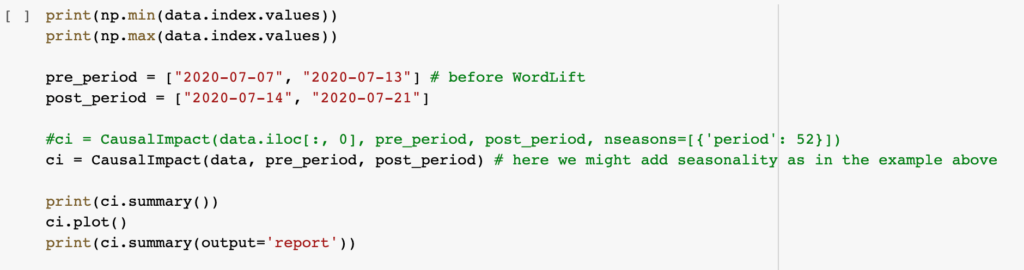
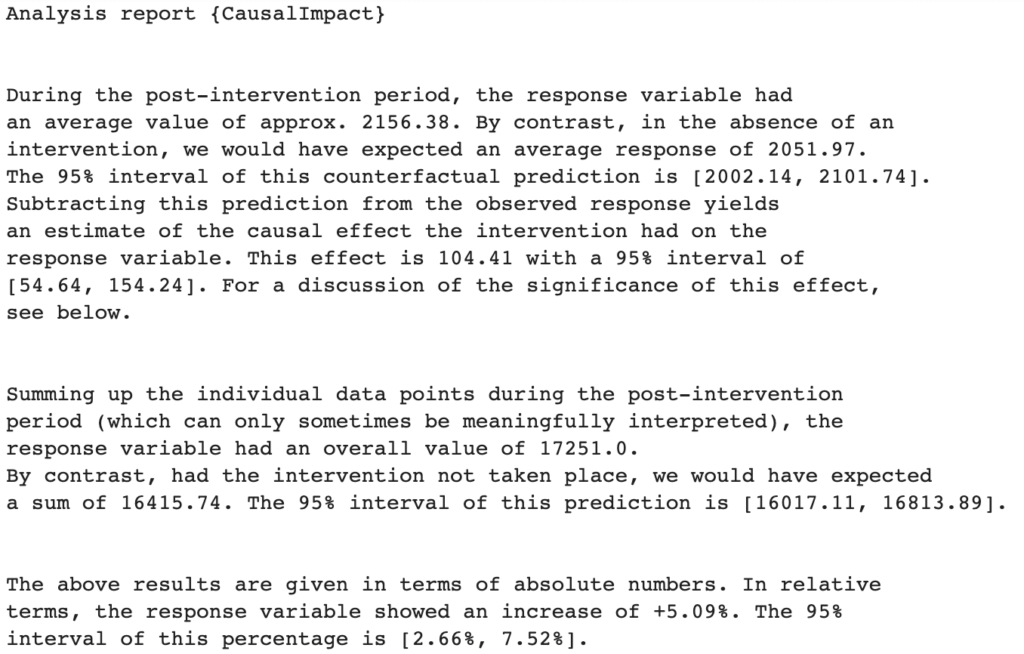
4. Run the analysis and get the response
With a few simple instructions you will get:
- the graphical response as well as
- the detailed summary of your experiment in written form.
Are you dealing with a complex SEO project? Find out more about our SEO Management Services.