How To Get Semantic Analytics With WordLift
Learn how to get semantic analytics with WordLift and create a dashboard using Google Data Studio and your traffic data.

In this article, we will help you create a Web Analytics Dashboard using Google Data Studio, traffic data from Google Analytics, and WordLift.
We constantly work for content-rich websites where sometimes hundreds of new articles are published daily. Analyzing traffic trends on these large properties and creating actionable reports is still time-consuming and inefficient. This is also very true for businesses investing in content marketing that need to dissect their traffic and evaluate their marketing efforts against concrete business goals (i.e., increasing subscriptions, improving e-commerce sales, and so on).
As a result of this experience, I am happy to share a Google Data Studio report that you can copy and personalize for your own needs.

Jump directly to the dashboard for Google Data Studio: Semantic Analytics by WordLift
Data is meant to help transform organizations by providing them with answers to pressing business questions and uncovering previously unseen trends. This is particularly true when your most significant asset is the content that you produce.
With the ongoing growth of digitized data and the explosion of web metrics, organizations usually face two challenges:
- Finding what is genuinely relevant to untap a new business opportunity is.
- Make it simpler for the business user to prepare and share the data without being a data scientist.
Semantic Web Analytics is about delivering on these promises, empowering business users, and letting them uncover new insights from analyzing their website’s traffic.
How To Activate Semantic Analytics With WordLift
With WordLift, you can create a custom dimension on Google Analytics that allows you to see traffic through the entities you have in your Knowledge Graph. This enables you to get semantic data about the traffic to your website without the need for an external dashboard, but directly in Google Analytics.
Entities annotated on web pages can also be sent to Google Analytics by enabling the feature in the WordLift settings panel with one click.
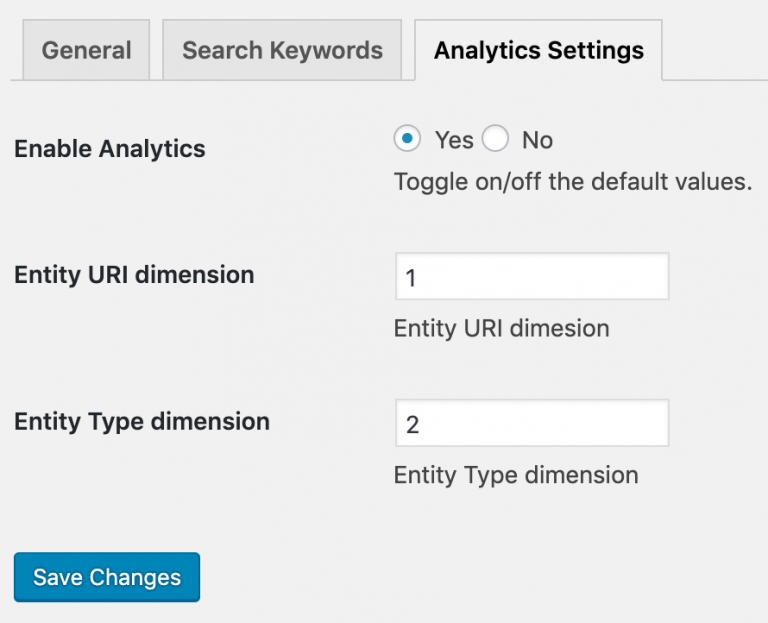
You can also define the dimensions in Google Analytics to store entity data, and this is particularly useful if you are already using custom dimensions.
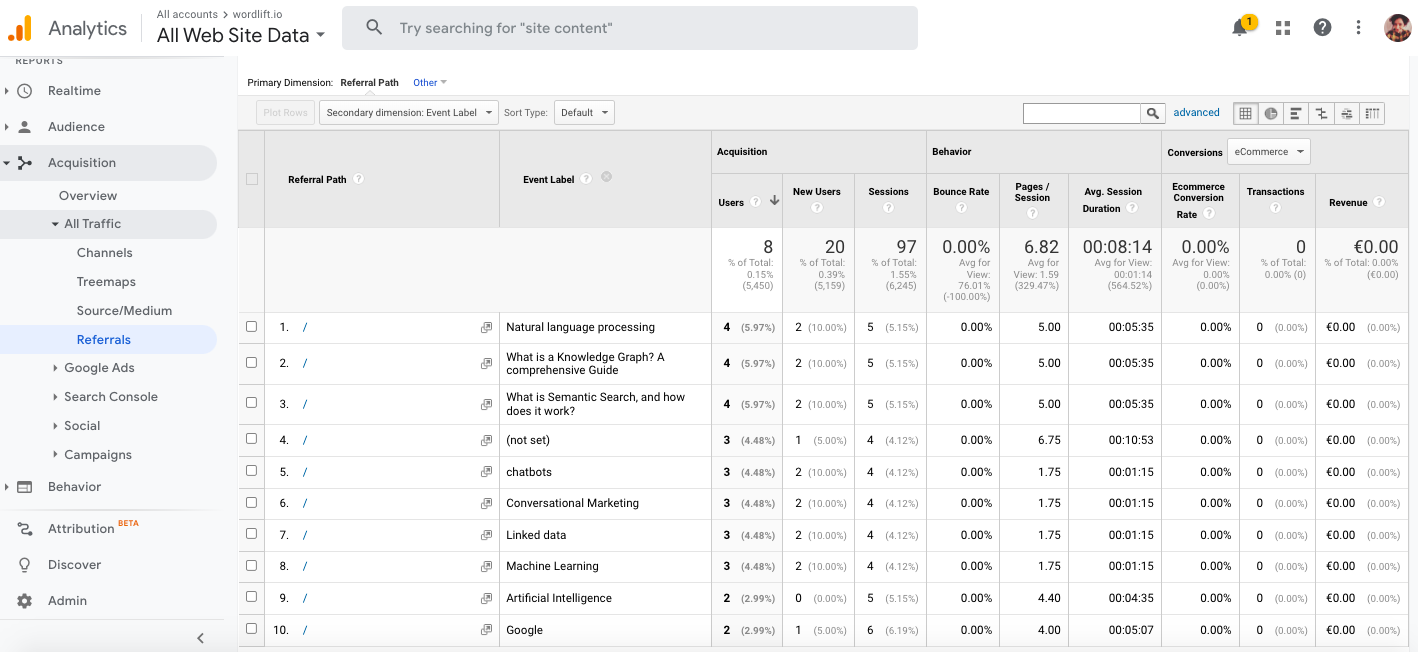
As soon as the data starts flowing, you will see a new category under Behaviour > Events in your Google Analytics.

WordLift will trigger an event labeled with the entity’s title, every time a page containing an annotation with that entity is open.
Using these new events, we can look at how content is consumed in URLs, site categories, and entities. Moreover, we can investigate how articles are connected with entities and how entities are connected with articles.
How Semantic Analytics Can Impact Your Business
Making sense of data for a business user means unlocking its power with interactive dashboards and beautiful reports. To inspire our customers, we built a dashboard using Google Data Studio – a free tool that helps you create comprehensive reports using data from multiple sources.
Using this dashboard, we can immediately see the concepts driving the traffic for each section of the website, what articles are associated with these concepts, and where the traffic is coming from.

We can also see the entities associated with a given article.

This helps publishers and business owners analyze the value behind a given topic. It can be precious to analyze the behaviors and interests of a specific user group. For example, on travel websites, we can immediately see the most relevant topics for, let’s say, Italian-speaking and German-speaking travelers.
WordLift’s clients in the news and media sector also use this data to build new relationships with advertisers and affiliated businesses. They can finally bring in meetings the exact volumes they have for – let’s say – content that mentions a specific product or a category of products. This helps them calculate in advance how they can monetize this traffic.
Are you ready to make sense of your Google Analytics data? Contact us and let’s get started!
Here is the recipe for a Semantic Web Analytics dashboard in Google Data Studio
With unlimited, free reports, it’s time to start playing immediately with Data Studio and entity data and see if and how it meets your organization’s needs.
To help with that, you can use the report I have just created as a starting point. Create your interactive report and share it with colleagues and partners (even if they don’t have direct access to your Google Analytics).
Simply take this report, make a copy, and replace with your own data!
[learn_more caption=”Instructions” state=”open”]
- Make a Copy of this file
Go to the File menu and click to make a copy of the report. If you have never used Data Studio before, click to accept the terms and conditions, and then redo this step.
- Do Not Request Access
Click “Maybe Later” when Data Studio warns you that data sources are not attached. If you click “Resolve” by mistake, do not click to request access – instead, click “Done”.
- Switch Edit Toggle On
Make sure the “Edit” toggle is switched on. Click the text link to view the current page settings. The GA Demo Account data will appear as an “Unknown” data source there.
- Create A New Data Source
If you have not created any data sources yet, you’ll see only sample data under “Available Data Sources” – in that case, scroll down and click “Create New Data Source” to add your own GA data to the available list.
- Select Your Google Analytics View
Choose the Google Analytics connector, and authorize access if you aren’t signed in to GA already. Then select your desired GA account, property, and the view from each column.
- Connect to Your GA Data
Name your data source (at the top left), or let it default to the name of the GA view. Click the blue “Connect” button at the top right.[/learn_more]
WordLift Connector for Google Data Studio
If you don’t have Google Analytics, don’t worry. We have developed a connector that allows you to hook your analytics platform into Google Data Studio, take the data and blend it with data from your Knowledge Graph ? Read the article!